Top25 2022, 2023 EDA
Overview
This section outlines the Top25 dataset.
See the CWE Top 25 Methodology for context on how the Top25 was created.
Introduction
The Top 25 dataset contains
- 9792 CVE-CWE mappings for 2023 dataset
- 9712 CVE-CWE mappings for 2022 dataset
where a mapping is one row with one CWE per CVE.
- There may be multiple rows with the same CVE to reflect multiple CWEs mapped to that CVE.
Top25 Remap
Pre-Remap
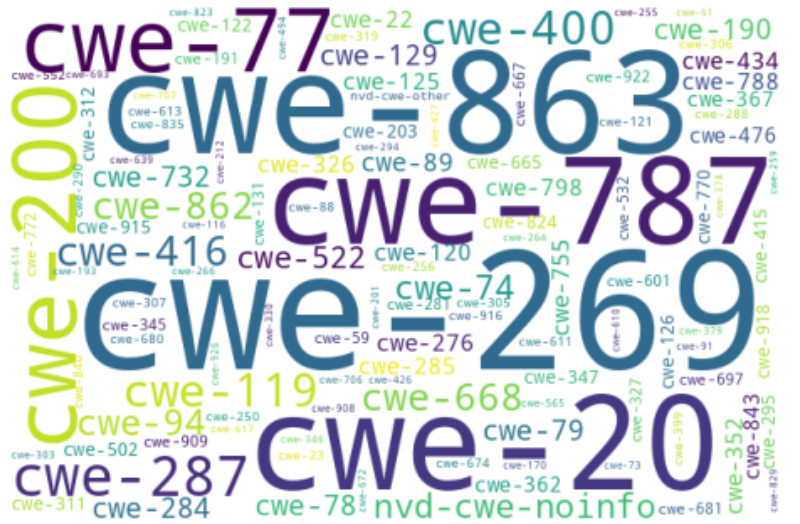
242 Unique CWE entries (including these that are not CWEs):
- nvd-cwe-noinfo
Post-Remap
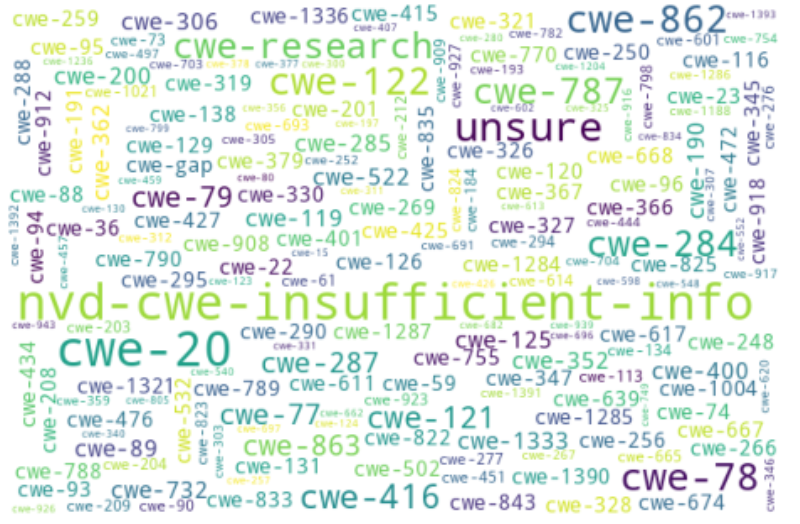
481 Unique CWE entries (including these that are not CWEs):
- nvd-cwe-insufficient-info 7.4%
- unsure 5.1%
- cwe-research 3.1%
Observations
Comparing CWE word clouds, some things are clear
- The Top 25 dataset contains double the number of unique CWEs compared to prior to remapping.
- The mappings are more fine grained
The number of unique CWEs per CVE is approximately the same for 2022, 2023.
Counts of CWEs per CVE
Distribution of counts of CWEs per CVE after Top 25 remapping i.e. how many CVEs have 1 vs 2 vs 3... CWEs per (REQ_COVERAGE_MULTIPLE_CWES)?
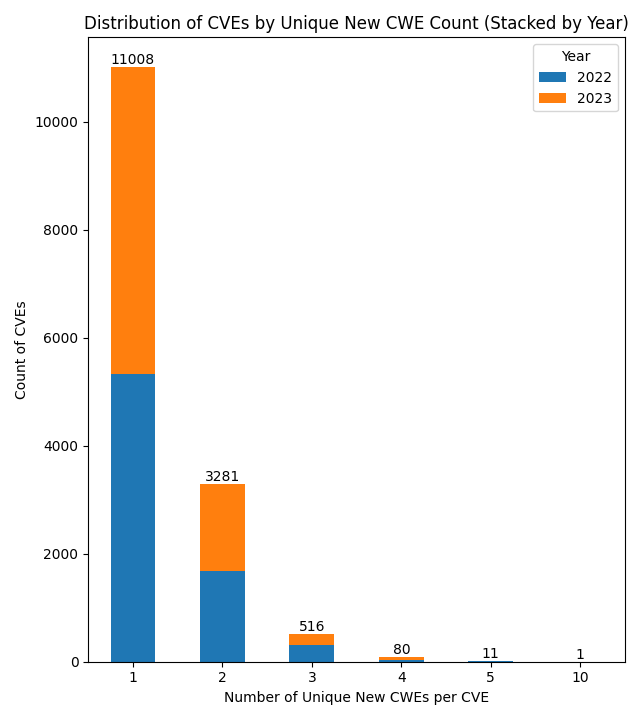
Observations
The number of unique CWEs per CVE is approximately the same for 2022, 2023.
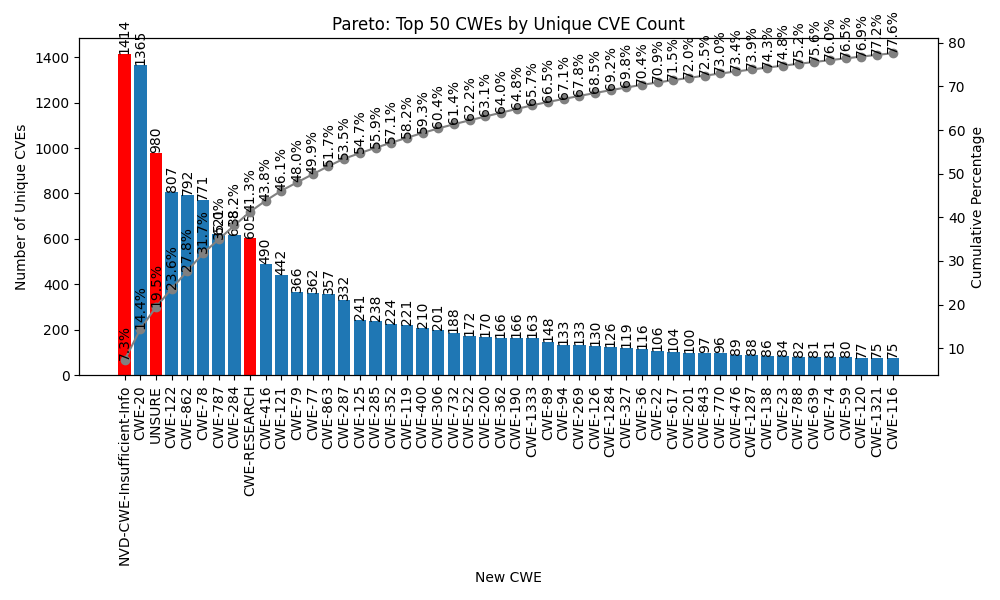
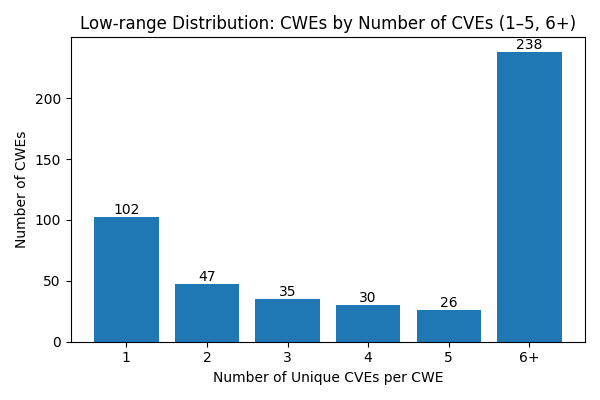
Counts of CVEs per CWE
Distribution of counts of CVEs per CWEs i.e. how many CVE examples per CWE do we have per (REQ_COVERAGE_MIN_ENTRIES_PER_CWE)?
Distribution by Hierarchy
Tip
Interact with the sunburst showing counts of CVEs per CWE from the Top25 2022, 2023 data
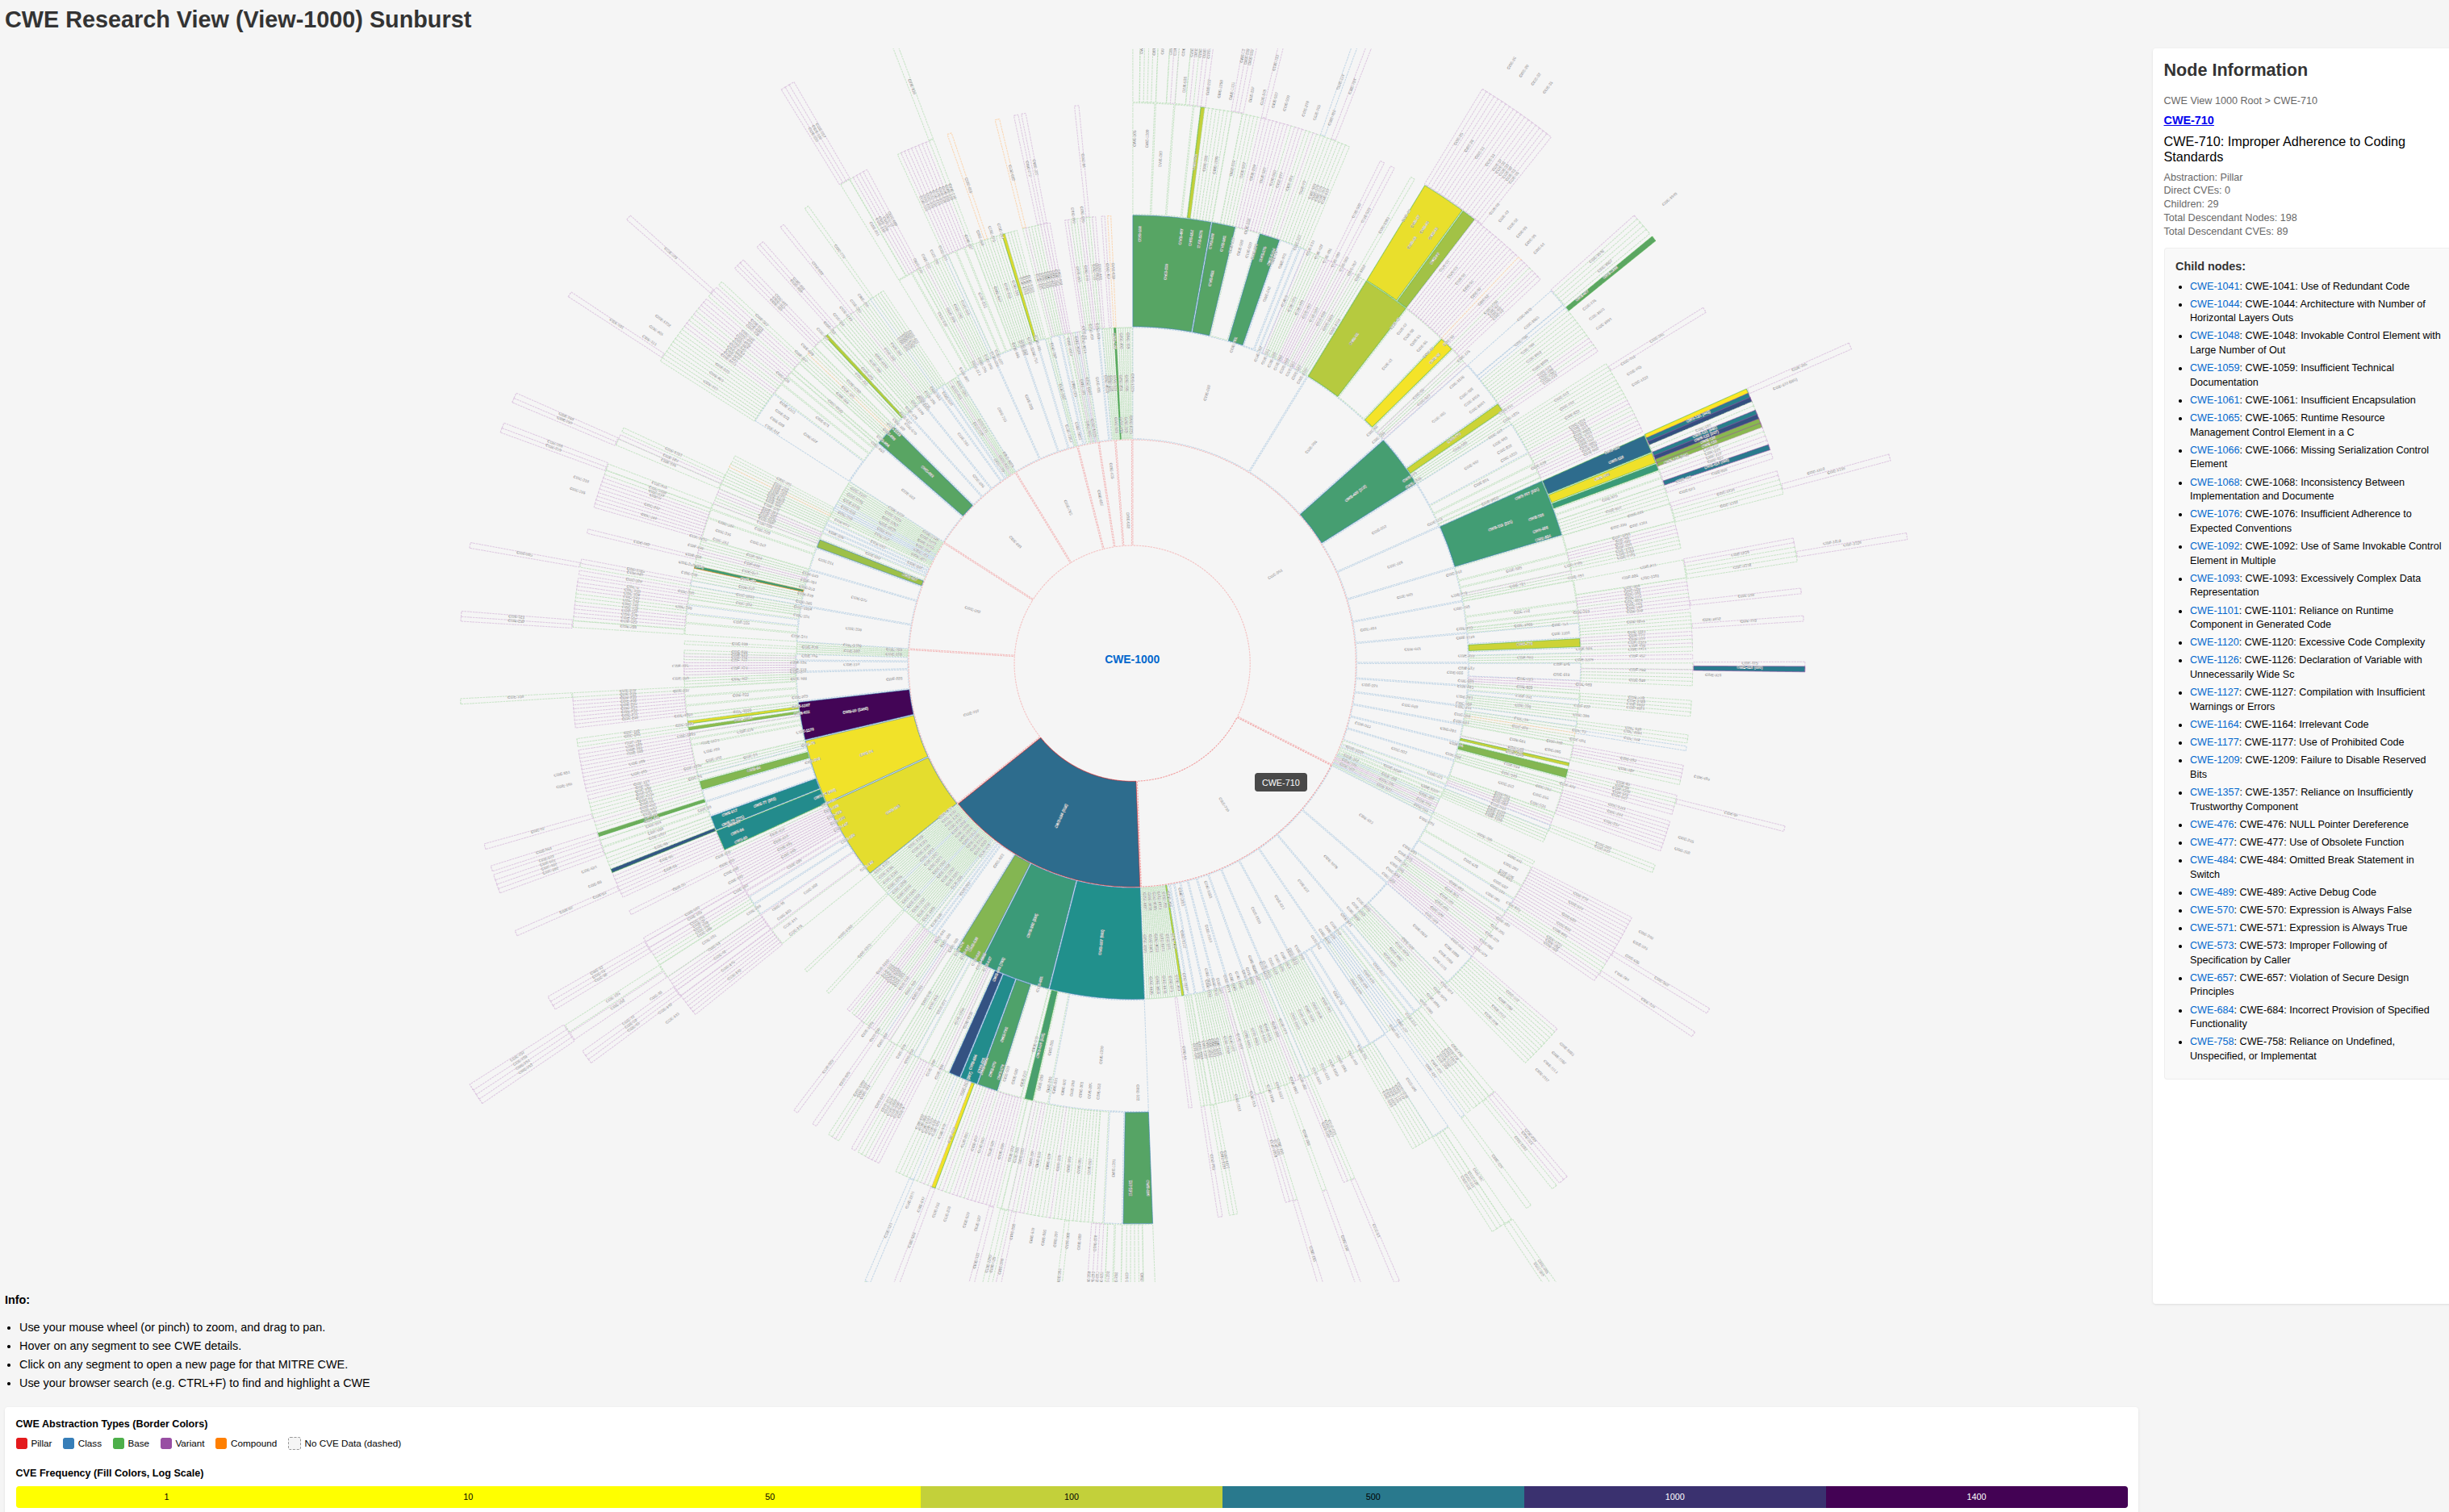 interactive sunburst showing counts of CVEs per CWE from the Top25 2022, 2023 data
Observations
The Top 50 CWEs by count, account for 77.6% of all CVEs.
~210 CWEs of ~480 have less than 5 CVEs.
From the interactive sunburst showing counts of CVEs per CWE from the Top25 2022, 2023 data, we can see that
some CWE Pillars have very few CVEs assigned e.g.
- CWE-435: Improper Interaction Between Multiple Correctly-Behaving Entities and CWE-697: Incorrect Comparison have a total of 0 CVEs in descendant CWEs.
- CWE-710: Improper Adherence to Coding Standards has a total of 89 CVEs in descendant CWEs.
The CWE Pillars with most CVEs assigned are
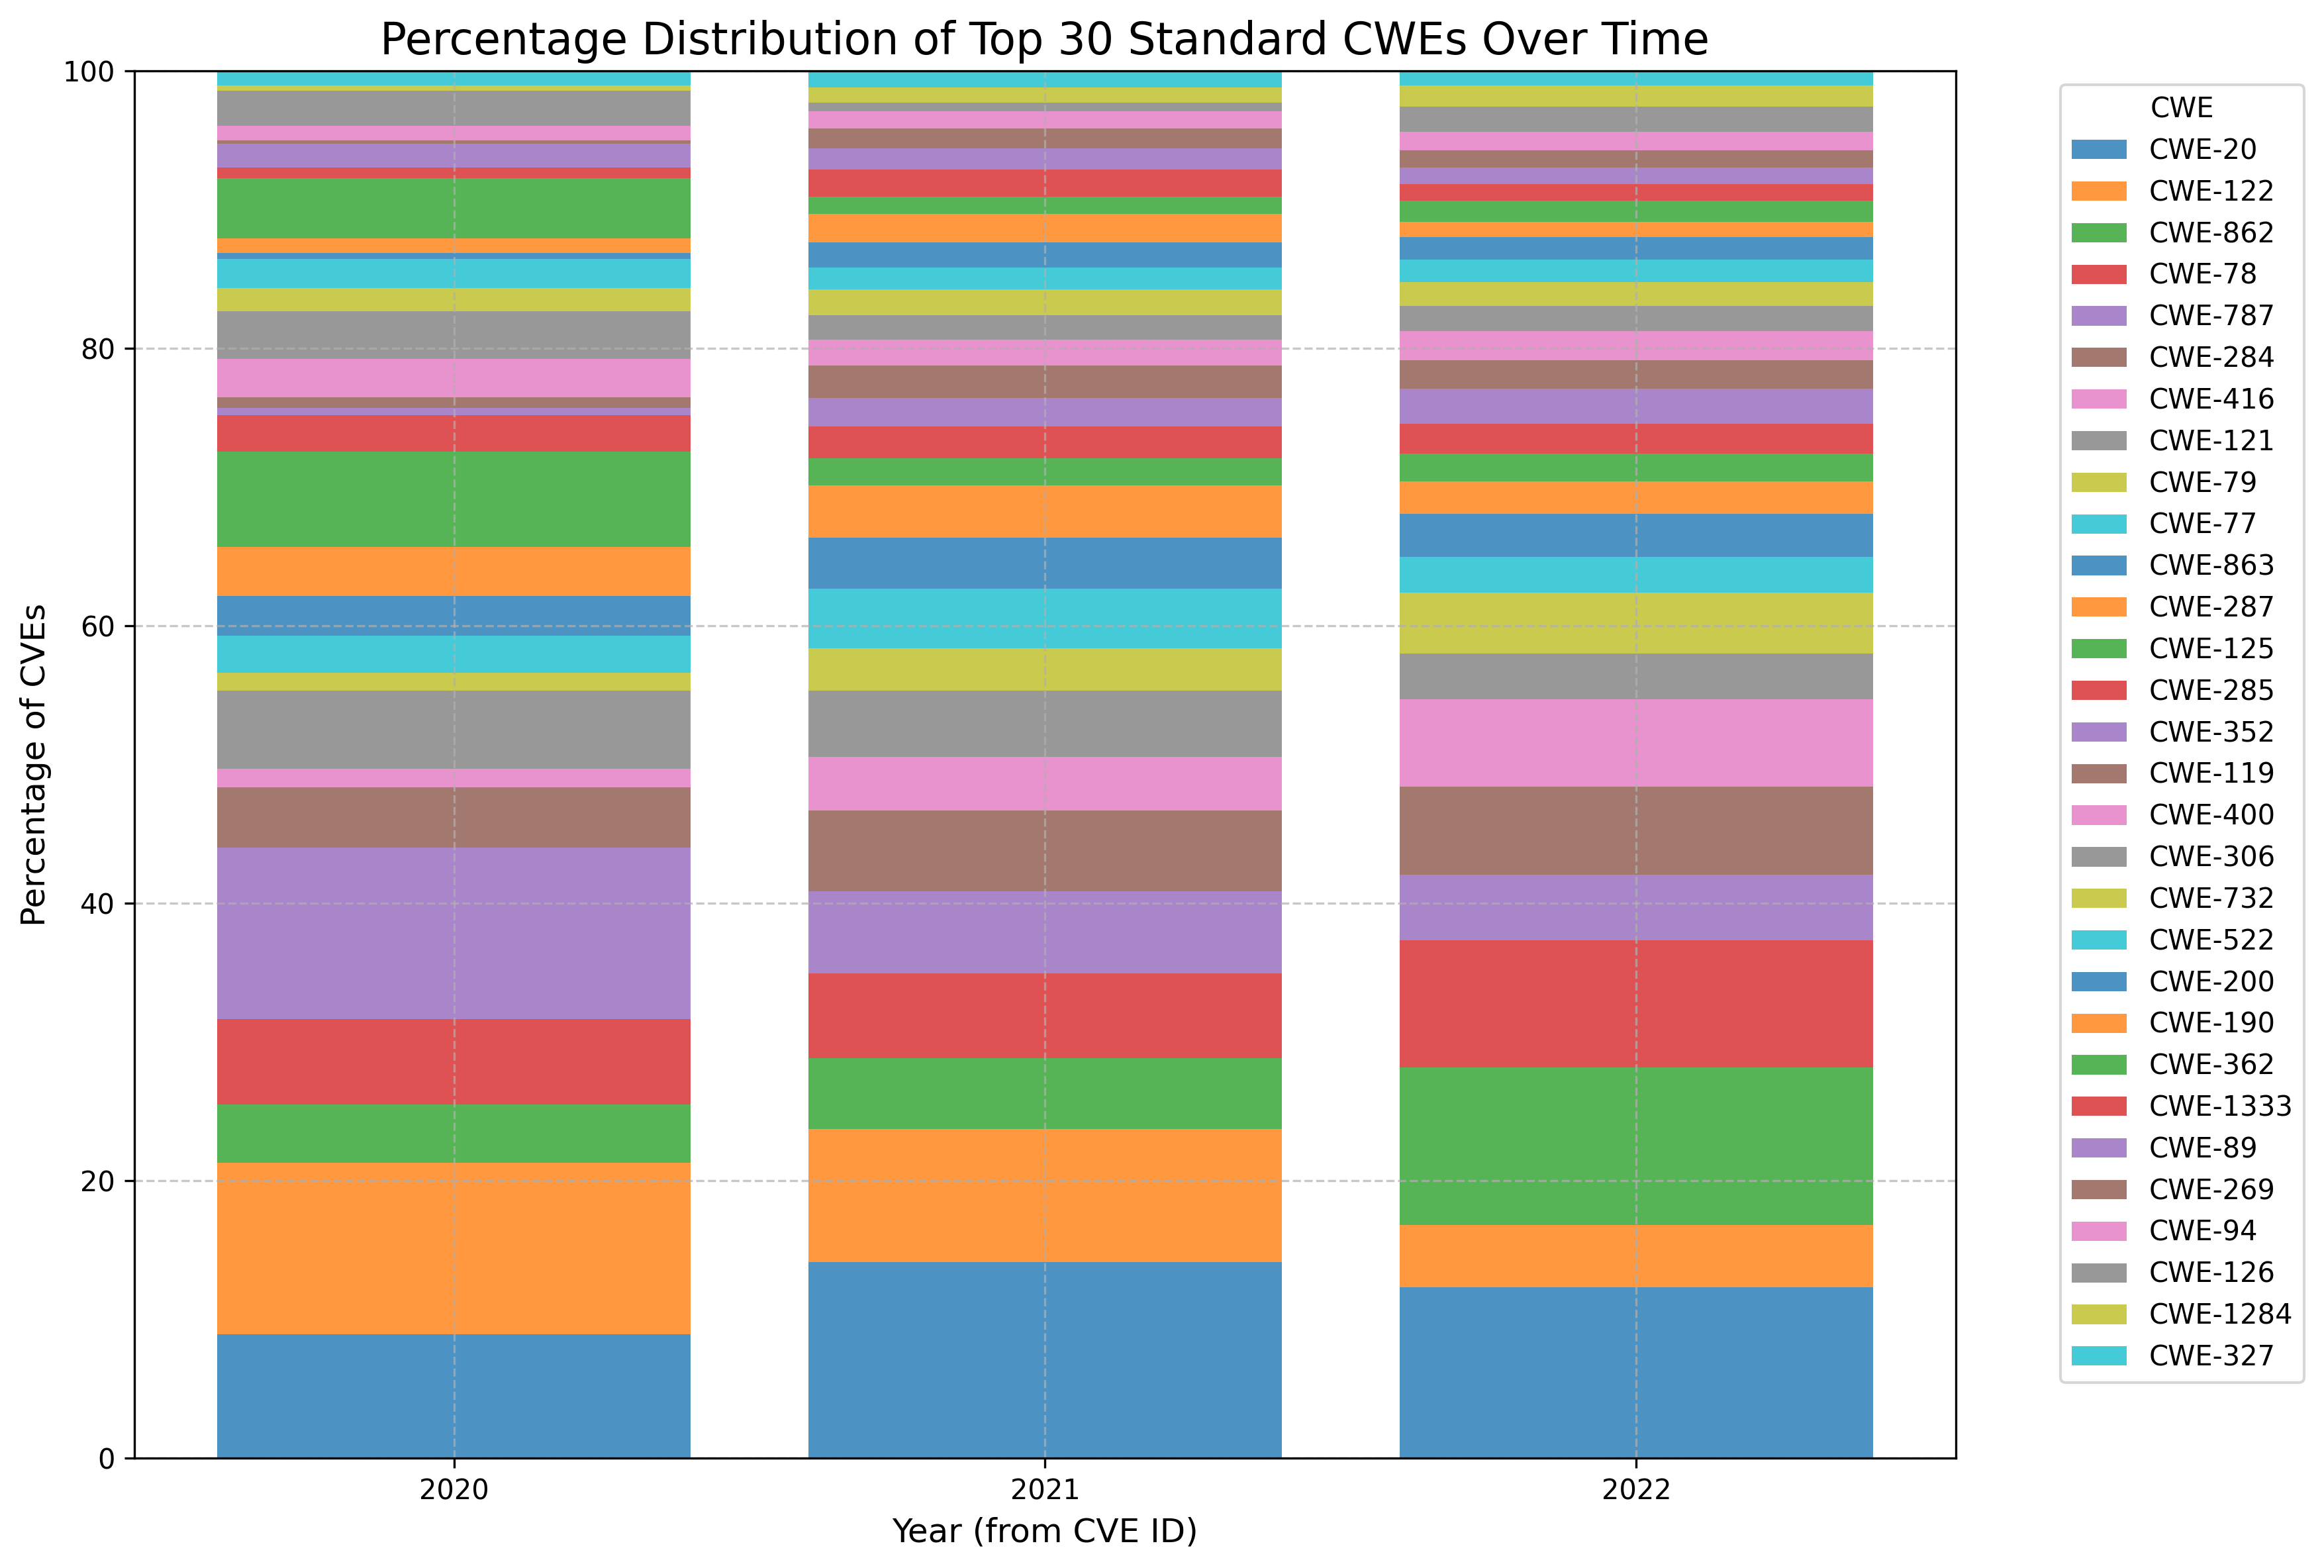
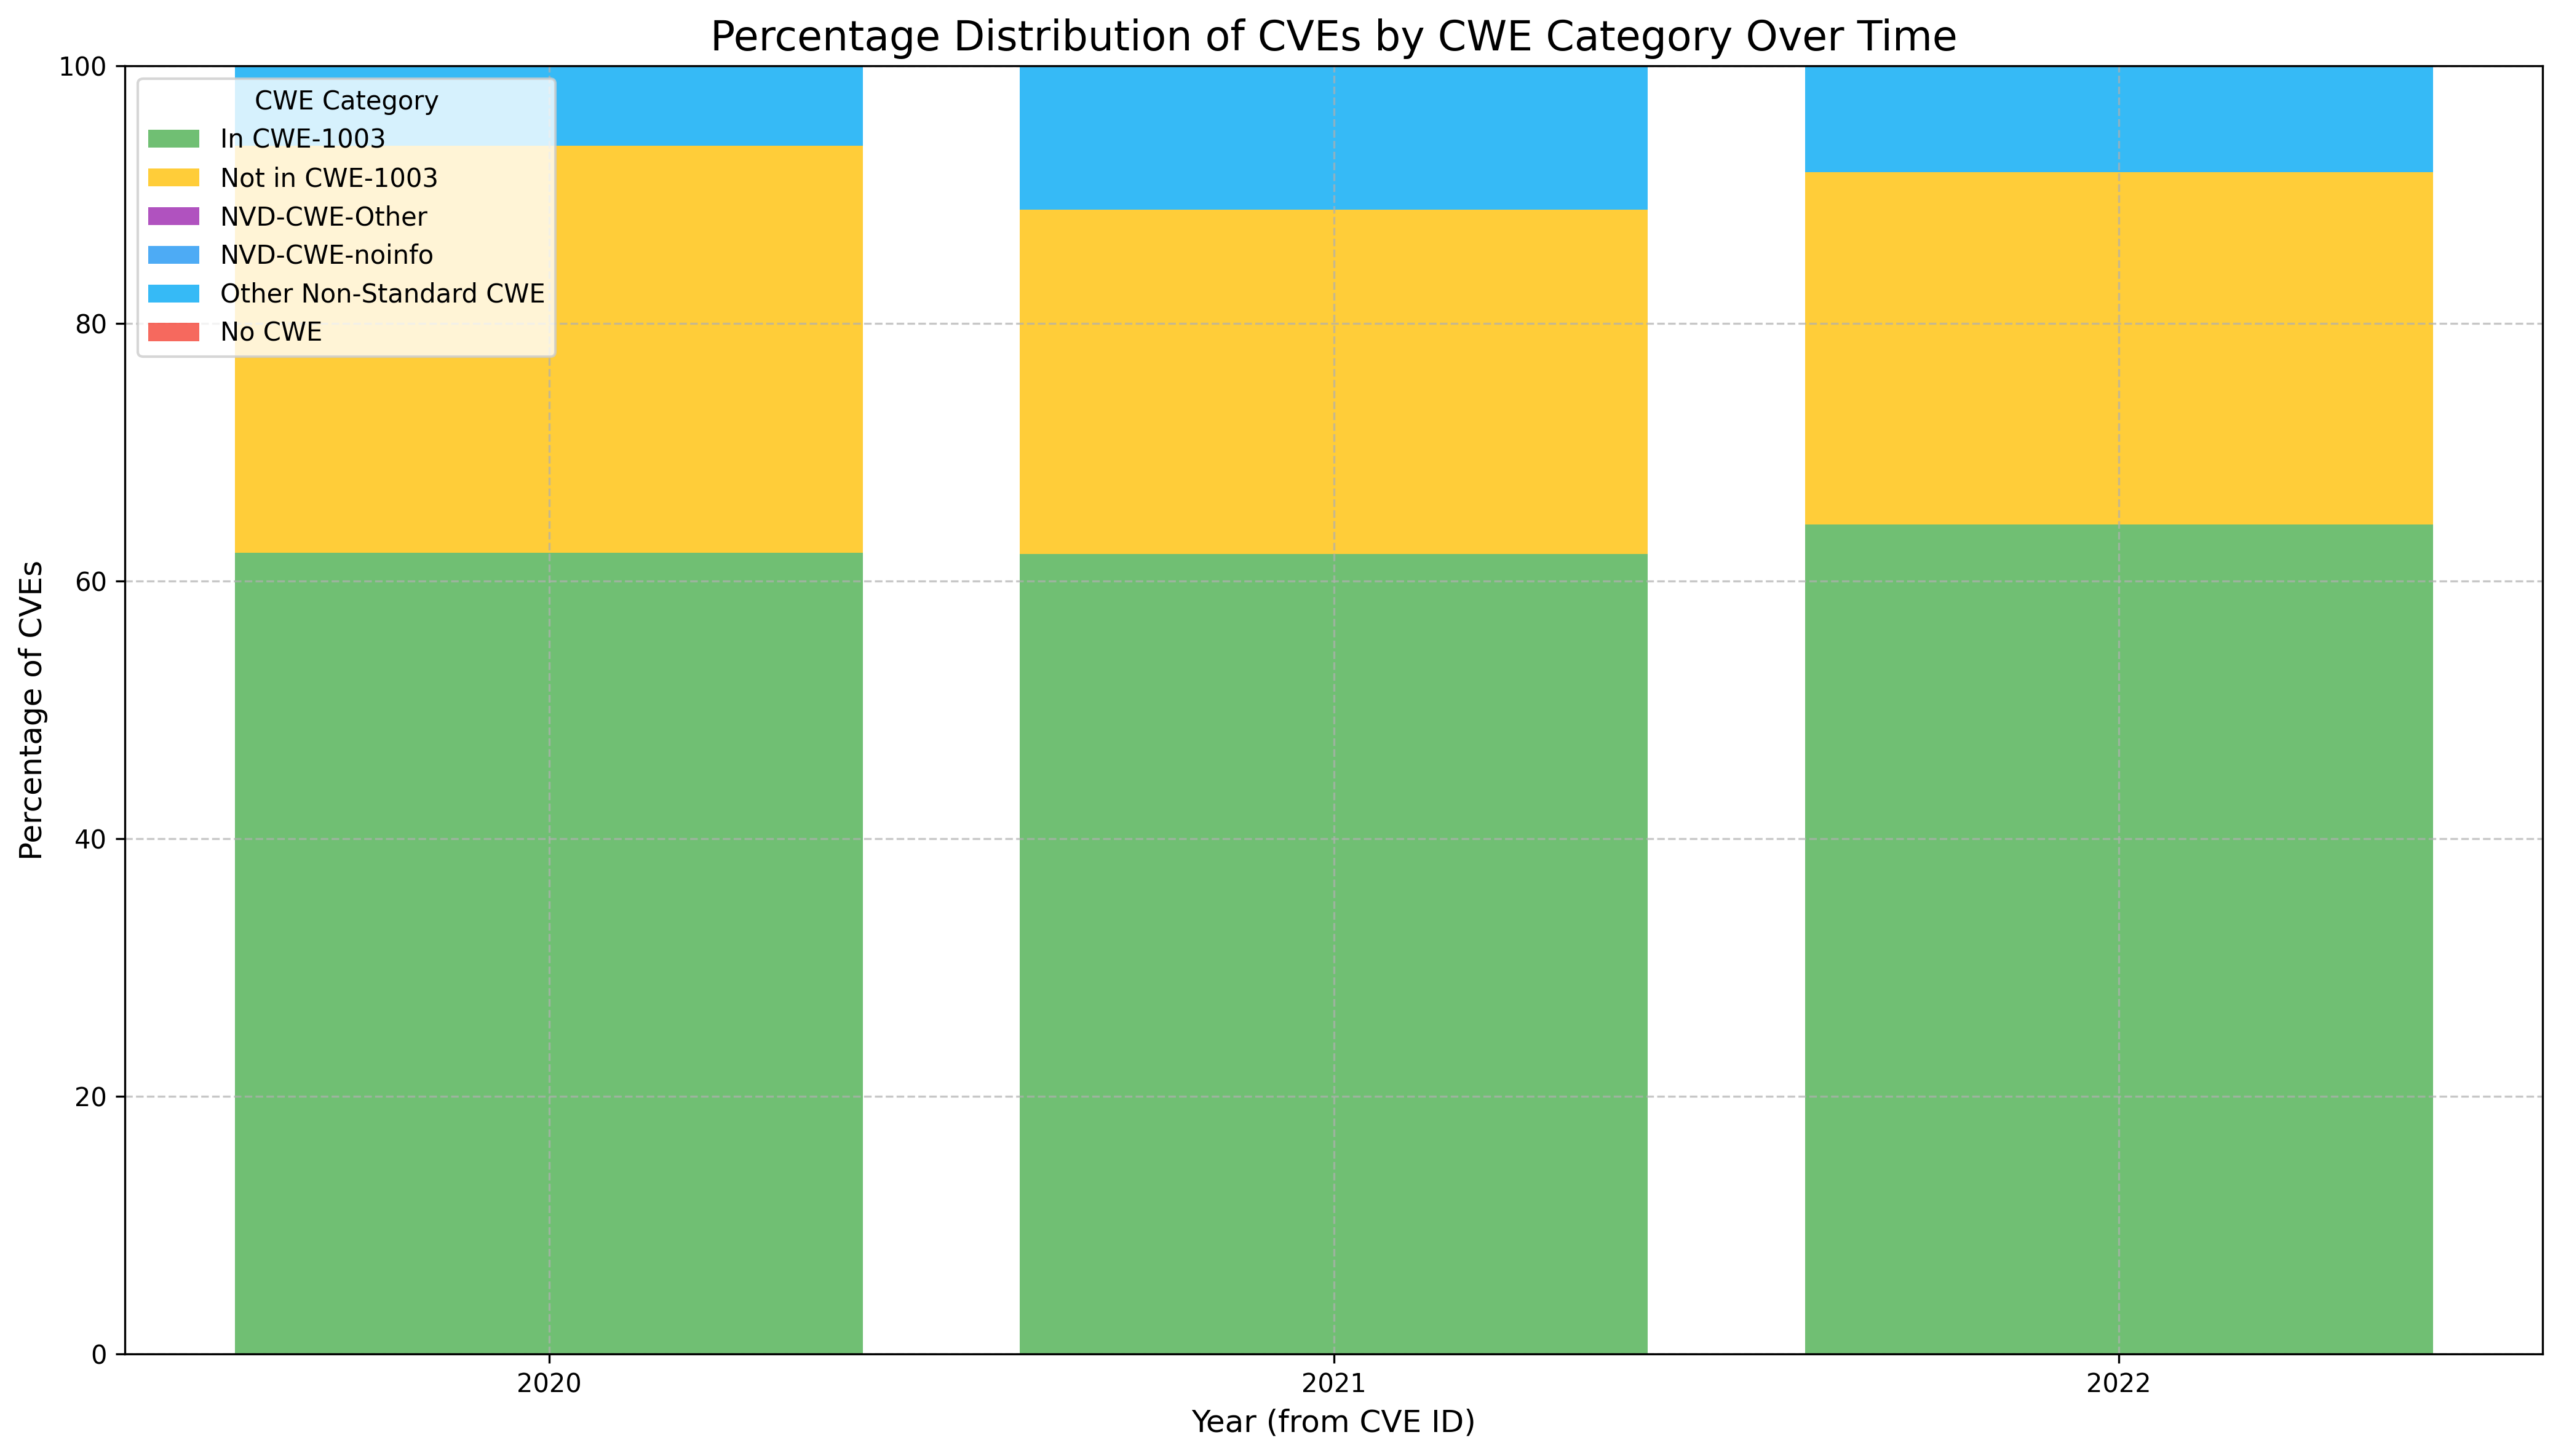
Percentage Distribution of CVEs by CWE per Year